
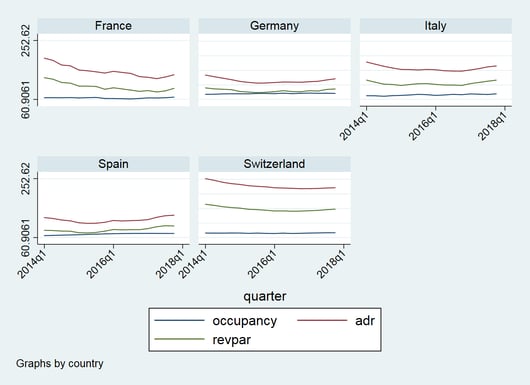
Figure 1: Occupancy,ADR, RevPar. Source: STR and authors’ calculations.
These signs of recovery in the hotel industry took place during an expansionary phase of the whole economy, as shown by the movements in real GDP registered over the last four years in the five European countries.
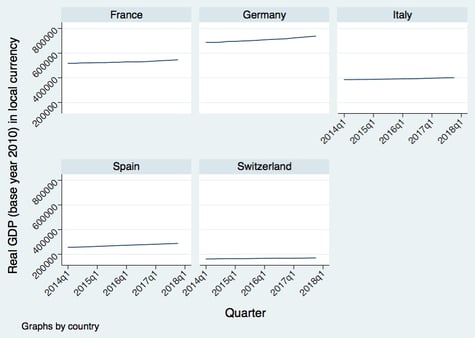
Figure 2: Real GDP, base year 2010 in local currency, seasonally adjusted. retrieved from FRED, Federal Reserve Bank of St. Louis
Over the whole period, we observed a positive correlation between real GDP growth and both ADR and RevPar, while we did not observe the same significant correlation with the occupancy rate (Table 1).
Table 1: Correlations
|
Growth |
|
|
Growth |
1 |
|
Occupancy |
0.1079 |
|
(0.357) |
|
|
adr |
0.2953 |
|
(0.0101) |
|
|
revpar |
0.3582 |
|
(0.0016) |
Source: STR, FRED data, author’s calculations.
An increase in income does not imply a strong increase in the number of rooms sold but rather in the price of the rooms. Standard microeconomics theory would argue that in competitive markets this is mainly due to the cost structure. In particular, an increase in the selling price is typically justified by an increase in the production costs that takes place whenever hotels are close to their capacity limit. If there is an expansion in demand, this generates an increase in costs that is then reflected in higher prices. Nonetheless, we observe that the average occupancy rate over the whole period for the five countries is 67.67%, far below the capacity limit. Around this rate, hotels reach or are above the break-even point, but they are definitely not at their capacity limit.
These results seem rather to suggest another story: Hotels are adopting a strategic behavior that consists of raising their prices during expansionary phases of the cycle. Below the break-even point, hotels’ supply is relatively elastic: Hotels play with quantities to make sure to reach their break-even point. Beyond the break-even, their strategy changes: Hotels rather renounce to strong increases in the number of rooms sold, and prefer to focus on margins instead.
References
Federal Reserve Bank of St. Louis and U.S. Bureau of Economic Analysis, Gross Domestic Product, Quarterly, Seasonally adjusted Annual Rate, retrieved from FRED, Federal Reserve Bank of St. Louis; https://fred.stlouisfed.org/series/GDP, May 2018.
STR, Trend Report for France, Germany, Italy, Spain and Switzerland, January 2014-December 2017.